Friday, September 11, 2020

Three projects and three goals for the next 6 months

(1) Alexandrium project

Research question: What are environmental drivers for blooms of Alexandrium in Bellingham Bay? 

Goal 6 months:

Question: Can we use already designed probes to quantify Alexandrium?

Use a TaqMan probe designed for identification of Alexandrium at the genus level to quantify Alexandrium fundyense and Alexandrium tamarense from culture. Then, use that same probe to quantify Alexandrium in Bellingham Bay.

(2) Pseudo-nitzschia project

Research question: What are environmental drivers for blooms of Pseudo-nitzschia in Bellingham Bay? 

Goal 6 months: 

Question: Can we use already designed probes to identify and quantify Pseudo-nitzschia?

Use rRNA-targeted probes in whole cell hybridization to enumerate cells in Bellingham Bay.

And, use Scanning Electron Microscopy (SEM) to quantify the cells.

(3) Longfin smelt project

Goal 6 months:

Can we use TaqMan probes to quantify Longfin smelt in the Nooksack River?

Sigma-Aldrich schematic for real-time PCR


How TaqMan Works -- Ask TaqMan® Ep. 13 by Life Technologies

Thursday, September 10, 2020

Webinar with Dr. Gregory Cajete

Today I attended a webinar with 1100 participants, including 137 different tribes. 

It is the 4th webinar in the series: "Indigenous Perspectives on Earth and Sky" 

"Native Astronomy through Native Eyes"  was presented by Dr. Gregory Cajete" 

Nancy Maryboy introduced the webinar series.

The webinar is part of a series that is planned by Indigenous Education Institute San Juan Island National Monuments, San Juan Island National Historical Park and BLM Collaborative Action and Dispute Resolution.

Description of webinar is here: Dr. Cajete is Professor Emeritus and former Director of the Native American Studies program at the University of New Mexico. He is a renowned author and artist from Santa Clara Pueblo, New Mexico. He has pioneered reconciling Indigenous perspectives in science with a western academic setting. His focus is on teaching culturally based science, with its emphasis on health and wellness. 

New day new Alexandrium

Currently, we do not have cultures of Alexandrium catenalla - therefore we will try to purchase A. fundyense. This means I need to find probes for A. fundyense. I learned this morning that A. fundyense and A. tamarense are closely related, while mating compatibilities even suggest them to be varieties of a single heterothallic species. 

Image of A. fundyense found at: https://microbewiki.kenyon.edu/index.php/Alexandrium_fundyense_NEU2011
Light microscope and Scanning Electron Microscopy images of Alexandrium species (Kim et al., 2017)


How will closely related species affect probe design? 

I read yesterday that a recent study couldn't make species-specific primers for the ITS1-5.8S-ITS2 rRNA gene region for Alexandrium catenalla. This was due to high nucleotide similarilty both with A. tamarense and A. fundyense (Galluzzi et al., 2010).

Well, now I need to know the difference between ITS1-5.8S-ITS2 rRNA gene and hypervariable D1-D2 domain. The diagram below helps me visualize where the regions are located. However, why use ITS rather than D1? Vandersea et al., 2017 reviewed two decades of investigations of Alexandrium species and found molecular studies designed species-specific assays for Alexandrium commonly targeted the hypervariable region in the LSU DI-D2 domain. 

Schematic representation of nuclear ribosomal DNA regions (Stockinger et al., 2010).

Vandersea et al., 2017 developed a species-specific PCR assay for A. fundyense Group  - not a TaqMan assay unfortunately - for which I am looking. 


Let me try explain using these figures:

TaqMan assay requires a forward and a reverse primer, as well as a reporter probe.

Shown here is the forward and reverse primers, as well as the TaqMan probe - with a "Q" quencher. The fluorescence occurs when the "R" is removed and leaves behind the "Q."


Hatfield et al., 2019 used a Taqman qPCR assay to target multiple species of Alexandrium. The assay targets a 125bp region of the 18S rDNA gene and was developed by de novo alignment of 25 Alexandrium species.They noted limitations to the assay - no resolution of taxonomy beyond Genus level. This is not useful for me - I want to identify species - I cannot use this assay. 


I will continue to look for primers and probes for A. fundyens. In the meantime, here are some figures I found today that show the interior of A. fundyense as well as the life cycle of A. fundyense.


Figure showing the interior of Alexandrium fundyense as it is infected by the parasite
Amoebophrya (Lu et al., 2016). This is a nice drawing of the interior of the Alexandrium
fundyense
cells.

Diagram of Alexandrium life cycle found at: https://microbewiki.kenyon.edu/index.php/Alexandrium_fundyense_NEU2011


Galluzzi, L., Bertozzini, E., Penna, A. et al. Analysis of rRNA gene content in the Mediterranean dinoflagellate Alexandrium catenella and Alexandrium taylori: implications for the quantitative real-time PCR-based monitoring methods. J Appl Phycol 22, 1–9 (2010). https://doi.org/10.1007/s10811-009-9411-3

Lu, Yameng & Wohlrab, Sylke & Groth, Marco & Glöckner, Gernot & Guillou, Laure & John, Uwe. (2016). Transcriptomic profiling of Alexandrium fundyense during physical interaction with or exposure to chemical signals from the parasite Amoebophrya. Molecular ecology. 10.1111/mec.13566. 

Kim, Eun & LI, Zhun & Oh, Seok & Ho, Yoon & Shin, H H. (2017). Morphological identification of Alexandrium Species (Dinophyceae) from Jinhae-Masan Bay, Korea. Ocean Science Journal. 52. 1-11. 10.1007/s12601-017-0031-6. 

Stockinger, H., Krüger, M. and Schüßler, A. (2010), DNA barcoding of arbuscular mycorrhizal fungi. New Phytologist, 187: 461-474. doi:10.1111/j.1469-8137.2010.03262.x

Robert G. Hatfield, Timothy Bean, Andrew D. Turner, David N. Lees, James Lowther, Adam Lewis, Craig Baker-Austin, 2019, Development of a TaqMan qPCR assay for detection of Alexandrium spp and application to harmful algal bloom monitoring, Toxicon: X, vol. 2, https://doi.org/10.1016/j.toxcx.2019.100011.


Wednesday, September 9, 2020

Sequencing primers and conditions

I am on the lookout for properties of sequencing primers for the A. catenella hypervariable D1-D2 domain, and primers for the qPCR analysis targeting this domain. I am also looking for the qPCR cycling conditions.

Garneau et al., 2011 selected primers UScatF (5-AACAGACTTGATTTGCTTGG-3) and UScatR (5-CACAGGAGACTTATCATTCATG-3) and produced a predicted PCR amplicon length of 141 bp.

The final qPCRs were  carried out in 50-l volumes containing:

  1.  10 ul of 1:100 crude lysate (5 to 10 ng of environmental DNA), 
  2. a 300 nM concentration of each primer, 
  3. and a 400 nM concentration of fluorogenic probe. 
  4. 1ul PCR colorless GoTaq Flexi buffer, 
  5. 7 mM Mg2,
  6. 200 M dNTP mix, 
  7. and 2.5 units of GoTaq DNA polymerase

All reagents, samples, and standards were prepared on ice prior to thermal cycling. PCRs and a blank control (no DNA added) were set up in triplicate in 96-well PCR plates sealed with flat strip caps (Bio-Rad; 2239441) and centrifuged briefly to remove bubbles. The qPCR thermal cycling conditions were as follows: 1 cycle of heating at 95°C for 3 min and then 40 cycles of 94°C for 15 s (denaturation), 53.2°C for 30 s (annealing), and 72°C for 30 s (extension). Thermal cycling and real-time data collection at the annealing step were performed using an iCycler iQ realtime PCR detection system (Bio-Rad Laboratories)  

Kamikawa et al., 2007 used primers specific to A. catenella: catF (50-CCTCAGTGAGATTGTAGTGC-30) and catR (GTGAAAGGTAATCAAATGTCC-30) and the
probewasTaqman cat (50-FAM-ATGGGTTTTGGCTGCAAGTGCA-
TAMRA-30).  

 PCR cycles were carried out using 10 ml volumes that consisted of:

  1. 1 ml of temperate DNA, 
  2. 0.3 mM of each primer pair, 
  3. 0.2 mM of the probe, 
  4. 1 LC FastStart DNA Master Hybridization Probes (containing PCR buffer, dNTP, MgCl2, and Taq polymerase) (Roche Diagnostics GmbH), 
  5. Mg2+ to a final concentration of 3 mM(Roche Diagnostics GmbH), 
  6. and PCR grade water to a final volume of 10 ml (Roche Diagnostics GmbH). 

The cycling conditions were as follows: one cycle at 95 8C for 1 min; 50 cycles at 94 8C for 15 s, 56 8C for 30 s, and 72 8C for 30 s.

First afternoon on the boat

 Today we took the 26’ aluminum chambered boat to Bellingham Bay to collect a Solid Phase Adsorption Toxin Testing (SPATT) sample (from the Se'lhaem buoy), YSI data (T, pH, Cond. dissolved oxygen, salinity data), and a tow (~5 m depth). 

Thayne with the Buoy in background.

A week-old SPATT sampler was attached to Se'lhaem .We cut it off and replaced it with a new SPATT sampler. The SPATT samplers are kept in the -80 freezer until LCMS-MS analysis.

Here is a link to video of Thayne setting up the YSI that collects environmental data. He is also collecting a VanDoren sample from 5 feet and 10 feet from the ocean surface. 


Tuesday, September 8, 2020

QuantStudio™ 6 Pro and 7 Pro Real-Time PCR Systems

Today is my first day in the lab!

Here are some of the things I see in the lab:
Frog fish https://www.bing.com/videos/search?q=frog+fish+eats&docid=608039039962123360&mid=118E8987D1FE343430A1118E8987D1FE343430A1&view=detail&FORM=VIRE
Frog Fish from the Museum of New Zealand to Papa Tongarewa.

Poster with key macroinvertebrate life in the river.


My first task is to figure out to how to calibrate the Applied Biosystems QuantStudio 6.   The Applied Biosystems™ QuantStudio™ 6 Pro and 7 Pro Real-Time PCR Systems use fluorescent-based polymerase chain reaction (PCR) reagents to quantify target nucleic acid sequences.  

The instrument collects raw fluorescence data at different points during the PCR cycle, depending on the type of run performed.

The QuantStudio™ 6 Pro Real-Time PCR System has a coupled five-color filter set. 

The QuantStudio™ 6 Pro System and the QuantStudio™ 7 Pro System have interchangeable blocks. 

The calibration status applies to the combination of the instrument and the block. If a block is moved to an instrument that it has not been calibrated on, that combination of block and instrument needs to be calibrated. This applies even if the block has previously been calibrated on a different instrument. If a block is moved back to an instrument that is has previously been calibrated on, it does not need to be calibrated again. It needs to be calibrated again if the calibration is expired. A run can still be started if a calibration of the block on the instrument is expired. A run cannot be started if a block has never been calibrated on the instrument.

Calibration workflow:

Perform an ROI/uniformity calibration

You are automatically prompted to perform background calibration.

Perform a background calibration

Perform any time that ROI/uniformity calibrations are current.

Perform system dye calibrations

Perform any time that ROI/uniformity and background calibrations are current.

(Optional ) Perform custom dye calibrations Perform any time that ROI/uniformity and background calibrations are current


I will need: 
  1. ROI/Uniformity plate
  2. Background calibration plate
  3. Dye calibration plates
Calibration procedure:

Thaw, vortex, and centrifuge a calibration plate

IMPORTANT! Keep calibration plates protected from light until you perform the calibration. Do not remove the plate from its packaging until you are ready to use it. Prolonged exposure to light can diminish the fluorescence of the dyes in the wells of calibration plates.

1. Remove the calibration plate from the freezer, then thaw the plate in its packaging for 30 minutes.

IMPORTANT! Use each plate within 2 hours of thawing.

2. While wearing powder‐free gloves, remove the calibration plate from its packaging. Do not remove the optical film.

Note: Do not discard the packaging for the calibration plate. Each calibration plate can be used up to three time if the following conditions are met:

· The plate is stored in its packing sleeve at –25°C to –15°C.

· The plate is used within 6 months after opening.

· The plate is used before the plate expiry date.

3. Vortex the plate for 5 seconds, then centrifuge at 750–1,000 × g for 2 minutes.

4. Confirm that the liquid in each well is at the bottom of the well and free of

bubbles. If it is not, centrifuge the plate again.

IMPORTANT! Keep the bottom of the plate clean. Fluids and other contaminants on the bottom of the plate can contaminate the sample block and cause an abnormally high background signal.


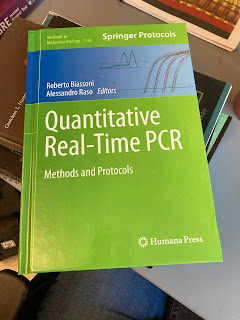
New book arrived!


Thursday, September 3, 2020

Fourier transform infrared spectrscopy and the amide region

 Are there organics in microbial biofilm that could interfere with the amide region of FTIR spectrum?

Infrared spectroscopy is one of the oldest and well established experimental techniques for the analysis of secondary structure of polypeptides and proteins.

Typical Amide I and Amide II peaks in FTIR spectrum (Fig. 1 from Kong and Yu, 2007).


Table 4 from Kong and Yu, 2007


Kong and Yu, 2007, Fourier Transform Infrared Spectroscopic Analysis of Protein Secondary Structures, Acta Biochimica et Biophysica Sinica, 39(8): 549–559


Are organic compounds used as mechanisms for crystallization of biominerals?

How are bones formed? There are prevailing theories regarding bone formation. For almost 25 years researchers have debated whether or not bone formation occurs from an amorphous precursor phase. 

Recently Olszta et al., 2007, wrote a review. In the review, they cover how organics (a collagen matrix) direct the growth of bone where non-collageous proteins (NCPs) are thought to play a role. The mineral phase (bone) is a nanostructured architecture consisting of uniaxially oriented nanocrystals of hydroxyapatite emedded within and roughly aligned parallel to the long collagen axes. Secondry (osteonal) bone, is laminated organic-inorganic composite composed of collagen, hydroxyapatite, and water.

Indeed, within the human body, organic matrices are used as mechanisms for direct crystallization of bones (primarily apatite; (Olszta et al., 2007)). This work is interesting to me today because it relates to work I've done looking at organic matrices produced by microorganisms. The organic matrices direct the growth of elemental sulfur.  


Tuesday, September 1, 2020

Tracking conditions that promote the onset of flourishing HAB events

Recently, I have had questions regarding the recent trends in paralytic shellfish toxin in Puget Sound. 

Turns out, there are local resources for those interested in trends in Harmful Algal Blooms in Puget Sound. One of these efforts is led by state managers, environmental learning centers, tribal harvesters, and commercial fish and shellfish farmers, called SoundToxins.

https://soundtoxins.org/about.html

 They have three goals that are also the goals for my postdoc project:

  1. to determine which environmental conditions promote the onset and flourishing of HAB events or unusual bloom events,
  2. to determine which combination of environmental factors can be used for early warning of these events and
  3. to document unusual bloom events and new species entering the Salish Sea.

I also found a publication from the School of Oceanography and Climate impacts and School of Aquatic and Fishery Sciences at the University of Washington and NOAA. 

Found here: https://www.fs.usda.gov/treesearch/pubs/35297 

Here, temporal and spatial trends in paralytic shellfish toxins in Puget Sound shellfish are documented dating back to 1957.

For the Salish Sea Research Center, there are 3 marine stations that collect data. If, these data include sea surface temperature, sea surface salinity, air temperature, precipitation, streamflow, tidal height difference, upwelling, wind speed, I might be able document paralytic shellfish toxin accumulation along with these environmental factors to track conditions that promote the onset of flourishing HAB events.

Moore, Stephanie K.; Mantua, Nathan J.; Hickey, Barbara M.; Trainer, Vera L. 2009. Recent trends in paralytic shellfish toxins in Puget Sound, relationships to climate, and capacity for prediction of toxic events. Harmful Algae. 8: 463-477.


National Tribal and Indigenous Climate Conference (NTICC)

I registered for and I will attend a virtual conference planned by the (1) Institute for Tribal Environmental Professionals (ITEP) Tribes and Climate Change program staff, the (2) Tribal Climate Change Project Advisory Committee members, and the (3) BIA Project Officer and staff. The National Tribal and Indigenous Climate Conference (NTICC) will be held September 14-17, 2020.

https://sites.google.com/view/2020-nticc-itep/home